Quick post because I found a file in our dropbox that hadn’t been processed properly.
I checked how word count changed over time for 20 white water writers camps over a reasonable period. The camps are all (I think) early secondary school: the outliers are groups with particularly difficult circumstances. This is what the chart looks like:
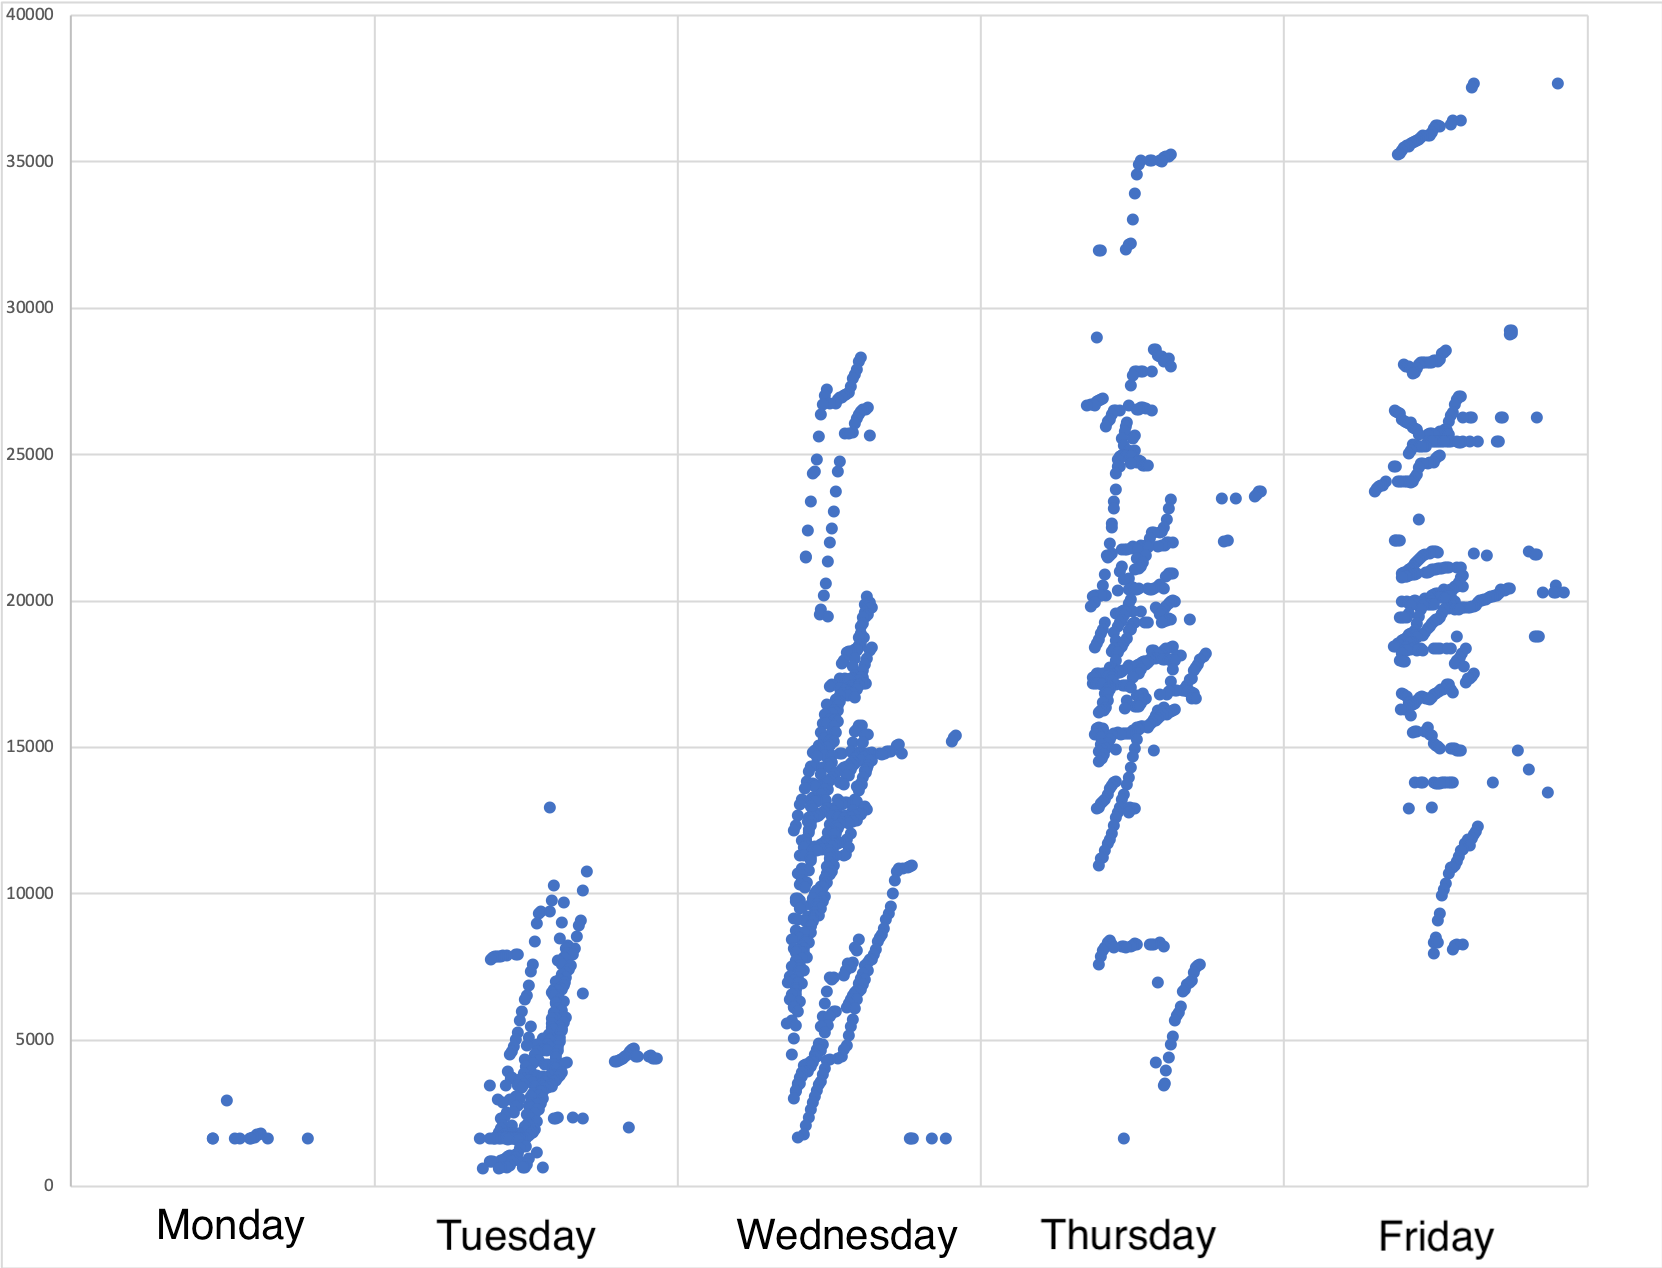
(this is all very rough btw, I crunched the numbers in excel and labeled the columns manually with an image editor…)
In general, I’d like a different shape to the chart: the highest word count should be late wednesday and then edit down for a couple of days, but it’s hard to be too grumpy about that when the camps I personally run show the same behaviour… I’m going to be doing a bit of thinking about how to push for more editing and less writing in the second half of the week and suggestions are very welcome.
Raw data is in this file: Wordcounts.